9kHz-3.2GHz/9kHz-7.5GHz RF Spectrum Analyzer
Overview
Suin’s spectrum analyzers incorporate all-digital IF technology and offer a frequency range from 9 KHz to 7.5 GHz. With their bench type and friendly user interface, they can present a bright easy to read display, powerful and reliable measurements.
Product Model
SA9232/SA9275
SA9232-TG/SA9275-TG
9kHz-3.2GHz/9kHz-7.5GHz RF Spectrum Analyzer is a sophisticated tool designed for analyzing and measuring radio frequency (RF) signals within the specified frequency range of 9 kHz to 3.2 GHz or 9 kHz to 7.5 GHz. It provides accurate and detailed insights into the power, frequency, and amplitude of RF signals, making it an essential instrument for testing and troubleshooting communication systems, wireless devices, and electronic components.
This spectrum analyzer is widely used in a variety of industries, including telecommunications, broadcasting, aerospace, and RF research. It helps engineers and technicians identify signal interference, evaluate spectrum occupancy, and ensure compliance with regulatory standards. With features like real-time analysis, signal demodulation, and high-resolution display, the RF Spectrum Analyzer offers both broad and detailed views of the frequency spectrum, enabling precise measurements and effective signal management for high-frequency applications.
Applications
R&D, education, production, maintenance, pre-compliance
Design Features
Frequency range from 9kHz to 7.5GHz
-160dBm Display Average Noise Level (Min.)
< -100 dBc/Hz @10 kHz Offset Phase Noise (Typ.)
Total Amplitude Accuracy < 0.8 dB
Preamplifier and EMI filter are standardly configured
Advance function interface
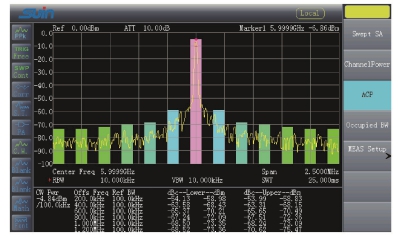
1. Adjacent Channel Power

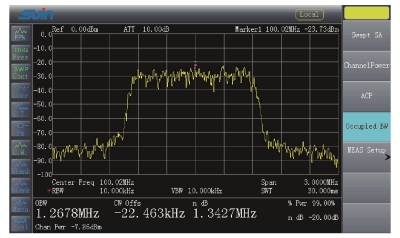
2. Occupied bandwidth

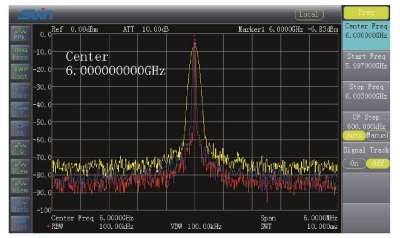
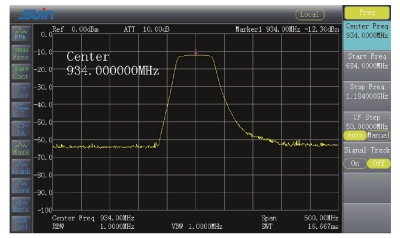
3. Different analysis width

4. Scalar network analyzer

When you are considering the purchase of a spectrum analyzer, you may have some questions, so let me answer them one by one:
The difference between a spectrum analyzer and a frequency analyzer lies in their application focus. A spectrum analyzer is primarily used to display the amplitude and frequency distribution of a signal's spectrum, while a frequency analyzer is more focused on accurately measuring and analyzing the frequency characteristics of a signal.
The difference between an RF power meter and a spectrum analyzer lies in their primary functions. An RF Power Meter is used to measure the power level of an RF signal, while a Spectrum Analyzer is used to analyze the spectral characteristics of a signal, including frequency distribution and amplitude.
RF Spectrum Analyzer is very versatile and can help you analyze the spectral characteristics of RF signals for applications such as signal monitoring, spectrum management, and wireless network optimization.
Spectrum analyzers can often be used as frequency counters, but this depends on the specific model and features. Some high-end spectrum analyzers have a frequency counter function that can accurately measure the frequency of a signal.
The main types of spectrum analyzers include scanning spectrum analyzers based on super-exception technology, real-time spectrum analyzers based on FFT technology, and vector signal analyzers. You can choose the right type according to your specific application needs.
You may also hear aliases for spectrum analyzers, such as spectrum meter, spectrum analyzer, spectrum scanner, and so on.
The accuracy of a spectrum analyzer depends on its technical parameters, performance characteristics and other factors. Generally speaking, high-end spectrum analyzers have high accuracy and precision to meet the needs of various precision measurements.
Some spectrum analyzers have the function of measuring signal power, but it is recommended that if you need to measure the power accurately, it is better to use a professional RF power meter.
When purchasing a spectrum analyzer, you need to consider its technical parameters, performance characteristics, scope of application, price and other factors to ensure that you choose the most suitable product for your needs.
| SA9232 Spectrum Analyzer | SA9275 Spectrum Analyzer | |
| Frequency Range | 9kHz~3.2GHz | 9kHz~7.5GHz |
| Resolution | 1Hz | |
| Aging Rate | ≤1*10-6/year | |
| Frequency Span | ||
| Frequency Span Range | 0Hz, 100Hz~3.2GHz | 0Hz, 100Hz~7.5GHz |
| Uncertainty | ±span/(sweep points-1) | |
| SSB Phase Noise(fc=1.0GHz) | -96dBc/Hz @ 10 kHz offset | |
| Bandwidth | ||
| Resolution Bandwidth (-3dB) | 10Hz~1MHz, step 1-3-10 | |
| RBW Uncertainty | 10%, nominal (RBW>1kHz) 20%, nominal(RBW≥10Hz, sweep time≥5s) | |
| Video Bandwidth (-3dB) | 1Hz to 1MHz, step 1-3-10 | |
| Amplitude | ||
| Range | DANL to +20dBm | |
| Maximum Input Level | DC Voltage: 50V | |
| CW RF Power: +20dBm (0.1W) | ||
| Max.Damage Level: +30dBm (1W) | ||
| Displayed Average Noise Level (DANL) | ||
| DANL (Preamplifier Off) | typ. -135 dBm | |
| DANL (Preamplifier On) | typ. -152dBm | |
| Reference Level Range | -100 dBm to +30 dBm, step 1 dB | |
| Sweep | ||
| Sweep Time Range | 1ms to 7500 s (100Hz≤Span≤7.5GHz) | |
| 20 μs to 7500 s (Span=0 Hz) | ||
| Sweep Time Uncertainty | 5%, nominal (100Hz≤Span≤7.5GHz) | |
| 0.5%, nominal (Span=0 Hz) | ||
| Sweep Mode | Continuous, Single | |
| Trigger | ||
| Trigger Source | Free, Video, External | |
| External Trigger Level | 5 V TTL level | |
| Advanced Measurement | ||
| Channel Power, Adjacent Channel Power, N-dB bandwidth, Occupied Bandwidth | ||
| EMI | 200Hz, 9kHz, 120kHz | |
| Input/Output | ||
| RF Input Impedance | 50 Ω | |
| Standard frequency | Frequency: 10MHz | |
Amplitude: 0dBm~10dBm (input) -3dBm to +3dBm (output) | ||
| Tracking Generator(-TG Model) | ||
| TG Frequency range | 100kHz to 3.2GHz | 100kHz to 7.5GHz |
| TG Output level range | -40dBm to 0dBm | |
| TG Output level resolution | 1dB | |
| Interface | ||
| Type | USB Host & Device, LAN, VGA | |
| General Characteristic | ||
| Power Supply | Input Voltage: AC100V to 240V | |
| Frequency: 50/60Hz (1±10%) | ||
| Power Consumption: 35W | ||
| Dimension & Weight | 363*154*327 mm, Approx. 6.5kg | |
Q: Does the Suin spectrum analyzer come with a tracking generator?
A: Yes, select model SA9275-TG when place order, which comes with tracking generator and preamplifier.
Q: Can the SA9275 demodulate input signals?
A: Yes, it can demodulate AM and FM signals. There is ‘Demodulation Tips_SA9100_9200’ from online manual download.
Q: Can I use the Suin SA9275 Spectrum Analyzer to perform EMI radiated emissions test?
A: Yes, all Suin spectrum analyzers can do that test with help of optional Near Filed Probe Set SY5030, of which details and operating instruction, please refer to ‘How to track EMI emissions Source ’ from online manual download.
Q: What’s the minimum resolution bandwidth (RBW) of SA9275?
A: It’s 10Hz
Standard Accessories
Power Cord:1pcs
N-BNC Adapter:1pcs
CD(Software+ User's Guide):1pcs
Options
Tracking Generator
N-SMA Adapter, N-SMA Cable, BNC-BNC Cable,
USB cable, RS-232 cable
Attena 1(900MHz/1.8GHz), Attena2(2.4GHz)
Near Field Probe Set SY5030